0
buses modelled live
Physics-grounded · Bayesian
GraphSolve Power turns noisy grid data into a clear, live picture of your network — and puts an honest confidence level on every number. Spot failing sensors, catch problems early, forecast demand, and relieve congestion, all in one place.
Why it matters
On a power network, “confident and wrong” is the failure that trips a system. GraphSolve Power is built the other way round: grounded in the real physics of your grid, and Bayesian to the core — so every answer arrives with a calibrated confidence you can act on.
Voltages, forecasts, sensor health — each comes with a clear confidence level. A model that tells you when it isn’t sure is a model you can actually run operations on.
Feed it a new reading and it updates its whole picture of the grid, showing exactly where confidence improved. It even tells you which extra measurement would sharpen things most — so you invest where it counts.
The real physics of your network is built into the model, so its answers stay sensible even where data is thin — and only get sharper as more data arrives.
Measured, not claimed
We put it to the test against the standard estimator used across the industry — on the IEEE-118 benchmark network, the same data into both. Same answer. Only ours tells you how far to trust it.
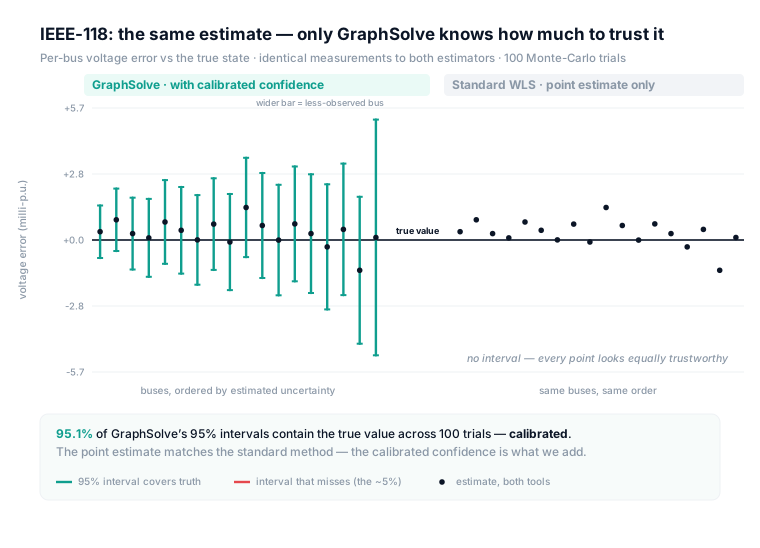
Calibrated on every value. Both methods return the same estimate — but GraphSolve adds a confidence interval that brackets the truth 95% of the time, and whose width tells you which points to trust. The standard method hands you a bare number.
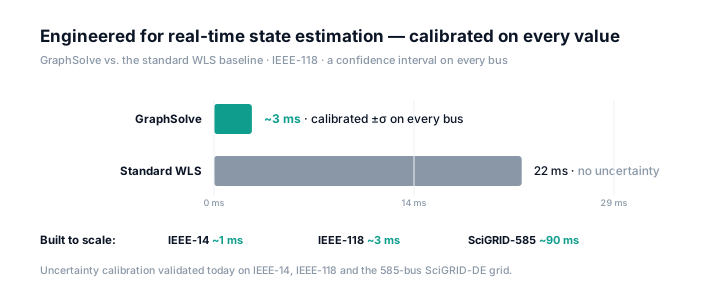
Built for real time, at scale. A calibrated confidence on every value, engineered to run faster than the standard estimator — and to scale from a single substation to a national grid.
The difference
Planning tools size the grid you might build.
We tell you the truth about the grid you’re running.
One live, trustworthy model of your whole network — the layer that sits between your sensors and every decision you make on them.
What it does
Explore each of these yourself in the live web demo — running on a real 585-bus national grid.
Turns thousands of noisy readings into one clear picture of the grid — every value with a confidence band, and bad data flagged automatically.
Spots sensors that have quietly drifted out of calibration — before their bad readings mislead your team.
Flags unusual patterns in live measurements and in event and alarm streams, ranked by how unusual they are.
Forecasts load with honest confidence bands that widen the further out you look — so you can plan around the risk, not just the number.
Finds the overloaded line under peak demand and recommends the cheapest way to bring it back within safe limits.
The live state, its confidence, and drift and anomaly alerts — updating continuously from your real-time feeds.
Works with your data
GraphSolve Power speaks the open standards the industry already uses, including the PyPSA modelling ecosystem. Point it at your network — or a public one — and the full picture comes to life. Our live demo runs on a real national transmission grid out of the box.
Our view on AI
Give AI better tools —
don’t dress its guesses up as physics.
AI is a superb interface. It makes powerful systems approachable and puts an expert at every operator’s side — and we lean into that: ask our assistant about your grid in plain language. But an interface is not a source of truth.
Where rigour — and sometimes lives — are on the line, the right way to bring AI into the control room is to give it real, physics-grounded tools to reach for, not to wrap a model’s output in more machine learning and call it physics. A neural network trained to emulate a grid is still a guess, and on a live network a confident guess is the dangerous kind. Our AI reaches for a calibrated model of your actual network — and reports what it truly says, uncertainty and all. The AI is the copilot; the physics is the source of truth.
How we compare
Everyone models the grid. Almost no one gives you a live, physics-grounded state with a calibrated confidence on every value — the top-right corner.
| Capability | GraphSolve Power | EMS / ADMS incumbents | Open-source SE | Physics-AI platforms | Forecast vendors |
|---|---|---|---|---|---|
| Real-time, physics-based state | ✓ | ✓ | ✓ | — | — |
| Calibrated confidence on every value | ✓ | — | ◐ | ◐ | — |
| Bad-data detection | ✓ | ✓ | ✓ | — | — |
| Sensor-drift detection | ✓ | — | — | — | — |
| Anomaly detection (signals & events) | ✓ | ◐ | — | — | — |
| Probabilistic forecasting | ✓ | ◐ | — | — | ✓ |
| Congestion relief | ✓ | ✓ | ◐ | ◐ | — |
| Open-standard / PyPSA interoperability | ✓ | — | ✓ | — | ◐ |
✓ full · ◐ partial · — none Categories, not specific vendors.
Who’s behind it
GraphSolve Power is built on the Data Insights AI engine — the same engine behind GraphSolve Energy, already trusted on some of the most complex physical systems in industry.
Founder. A renowned physicist, mathematician and graph-theory pioneer — computer scientist and lecturer, and author of Lagrangian & Hamiltonian Dynamics (Oxford University Press, 2018). The research mind behind the engine.
Founder. Scientific software developer, numerical-modelling specialist and optimisation expert — the engineering depth that turns the research into a product operators can run.
Trusted on industrial systems in the North Sea · GCC · LATAM
Get started
A live, web-based demo on a real national grid — no install. Walk through it yourself, or let us show you.